The Pilot Ended. Nobody Knows If It Worked.
The program ran a pilot. It lasted four weeks. The site leader says it went well. The team moved to Wave 1 on schedule. There were some issues, but the team worked through them. The general consensus is that the pilot was a success. Ask the team what “success” means and the answers diverge. The project manager points to on-time completion. The site leader points to positive informal feedback. The executive sponsor points to the absence of major failures. Nobody points to data because nobody defined what data to collect or what thresholds would constitute success. This is the gap between having a pilot and having success criteria. The pilot happened. The learning didn’t. The team moved to the next wave based on consensus and calendar rather than evidence.
What Happens When Go/No-Go Is Implicit
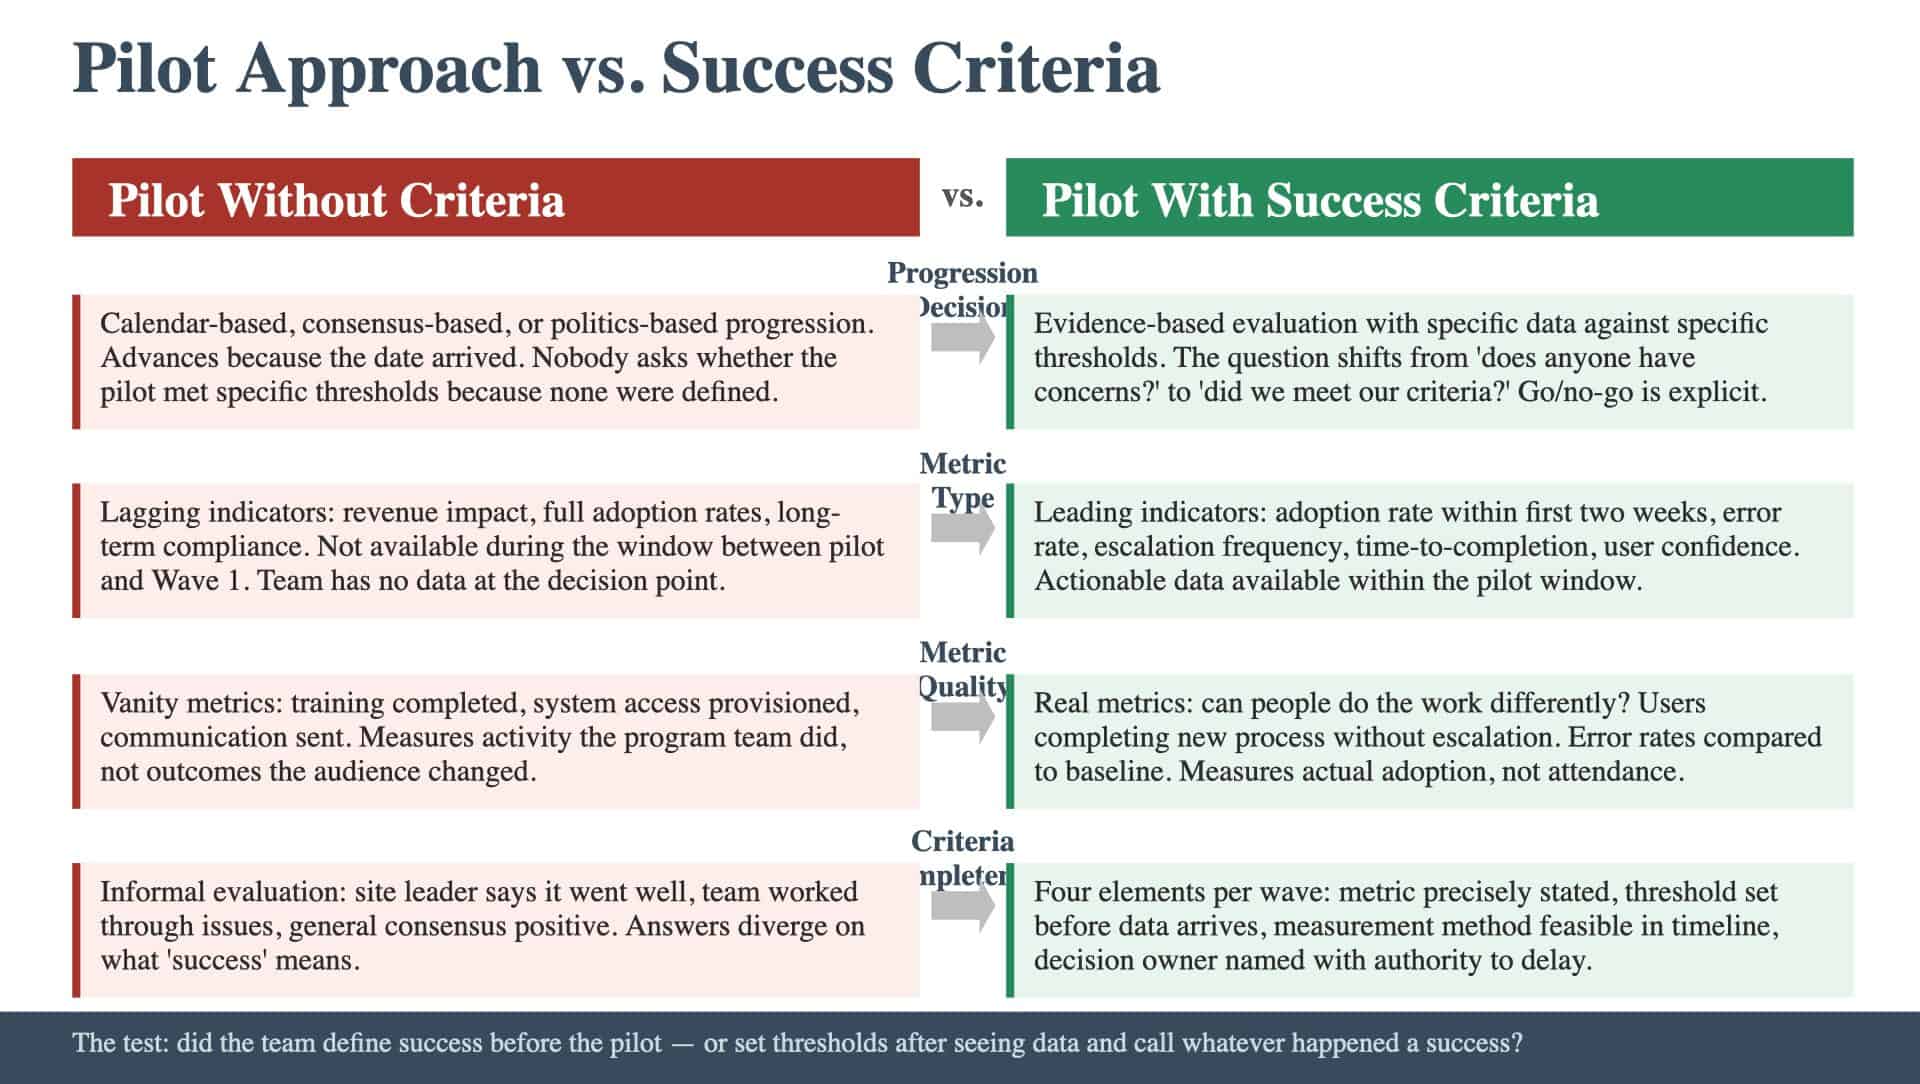
Without defined success criteria, progression decisions default to one of three patterns, none of which is evidence-based. Calendar-based progression. The pilot ends on the scheduled date. The next wave starts on the scheduled date. There is no evaluation point between them. The program advances because the timeline says it should. Consensus-based progression. The team discusses how the pilot went. If nobody raises a strong objection, the program advances. This approach favors optimism and penalizes dissent. The person who noticed that adoption was only 60 percent stays quiet because the general tone is positive. Politics-based progression. The executive sponsor wants to see momentum. The program manager wants to demonstrate progress. The site leader wants credit for a successful pilot. Nobody has an incentive to say “this didn’t work” because there’s no framework that makes that a legitimate conclusion. Defined success criteria interrupt all three patterns. They create a structured evaluation point where the team looks at specific data against specific thresholds and makes a decision based on evidence. The question shifts from “does anyone have concerns?” to “did we meet our criteria?”
Leading Indicators vs. Lagging Indicators
The first mistake in defining success criteria is selecting metrics that take too long to materialize. Revenue impact, full adoption rates, long-term process compliance: these are lagging indicators. They matter, but they won’t be available during the window between the pilot and Wave 1. Leading indicators tell the team early whether things are working. They measure the precursors of success rather than success itself. Examples of leading indicators for a rollout pilot:
- Adoption rate within the first two weeks. What percentage of the target audience is using the new process or system? Early adoption rates predict later adoption patterns.
- Error rate during the transition period. How many errors are occurring as people use the new process? High error rates indicate capability gaps or process design issues.
- Escalation frequency. How often are users escalating issues to the support team? High escalation rates indicate that users can’t complete the process independently.
- Time-to-completion. How long does it take users to complete key tasks in the new process compared to the old one? If the new process is significantly slower, adoption will suffer.
- User confidence scores. Do users report that they can do the new work independently? Self-reported confidence correlates with sustained adoption.
The distinction matters for timing. If the pilot runs for four weeks and the success criteria rely on lagging indicators, the team won’t have data at the decision point. If the criteria use leading indicators, the team has actionable data within the first two weeks.
The Vanity Metrics Problem
The second mistake is selecting metrics that are easy to hit but don’t indicate real adoption. These are vanity metrics: they look good in a progress report but don’t predict whether the change will stick. “Training completed” is the most common vanity metric. It measures whether people attended a session, not whether they can do the work. A program can report 100 percent training completion and still have 40 percent adoption because the training didn’t translate into capability. “System access provisioned” is another vanity metric. It measures whether people have login credentials, not whether they’re using the system. “Communication sent” measures whether messages were transmitted, not whether they were received or understood. The test for whether a metric is real or vanity: does this metric tell us whether people are actually doing the work differently? If the answer is no, it’s a vanity metric. It measures activity (things the program team did) rather than outcome (things the audience changed).
What Complete Success Criteria Look Like
For each wave, success criteria should include four elements: The metric. What specifically is measured. Stated precisely enough that two people would measure it the same way. Not “adoption” but “percentage of target users who completed at least three transactions in the new system during the first two weeks.” The threshold. What value constitutes success. A number, a percentage, a binary condition. Not “high adoption” but “75 percent of target users completed at least three transactions.” The threshold should be set before the wave begins, not after the data comes in. The measurement method. How the data is collected. System logs, surveys, observation, escalation tracking. The method should be feasible within the wave timeline and not depend on data sources that don’t exist yet. The decision owner. Who makes the go/no-go call when the data comes in. This should be a named individual with the authority to delay the next wave, supported by clear wave gate requirements. If the decision owner is the same person who’s under pressure to maintain the timeline, the criteria will be rationalized rather than enforced.
How to Build Criteria from What You Have
Programs at this stage have a pilot approach but haven’t formalized the evaluation. The criteria build from the risk register and the change plan.
- Start with the risks. The risk landscape identified specific failure modes. Each high-priority risk becomes a candidate for a success criterion. If the risk register flagged “users may struggle with the new interface,” the success criterion measures interface usability: error rates, time-to-completion, or escalation frequency.
- Check the change plan. The readiness assessment identified audiences with capability or willingness gaps. For each gap, define a metric that tells the team whether the gap is closing. If the readiness assessment flagged low capability in a specific audience, the success criterion for that audience measures whether they can complete the new process independently.
- Set the thresholds before the pilot begins. This is the discipline that separates criteria from retroactive rationalization. The question is whether the team defines what success looks like before the pilot begins and evaluates honestly against it: or whether it sets thresholds after seeing the data and calls whatever happened a success.
Keep Reading
New to the Rollout Plan? Start with the foundations:
Ready to benchmark your work against best-in-class? See what excellence looks like: