The Program
A global financial services firm is migrating its trading and operations platform across 8 regional offices in 4 time zones over 12 months. The platform affects every front-office and middle-office role: traders, risk analysts, operations specialists, compliance officers, and regional managers. The integrated roadmap defines the build sequence. The operating model establishes governance. The change plan maps 9 distinct audiences across the regional offices. The Rollout Plan was built during Step 8, after the roadmap, operating model, and change plan were complete. Here is what each component looked like and what drove the decisions behind it.
The Rollout Sequence: Why Singapore Went First
The initial proposal put London first. It was the largest office, the executive sponsor’s home base, and the most visible to senior leadership. The logic was momentum: a successful London launch would signal organizational commitment. We challenged this. London was the highest-risk environment: the largest population, the most complex trading workflows, the highest regulatory scrutiny, and the least tolerance for disruption. A London failure would be the most visible possible outcome. The final sequence:
- Pilot: Singapore. Mid-sized office, representative complexity, strong local leadership, and a time zone that allowed the global support team to monitor overnight (relative to London and New York). If the pilot failed, the blast radius was containable.
- Wave 1: Hong Kong and Sydney. Similar time zone to Singapore. Lessons from the pilot could transfer with minimal adaptation. Combined population large enough to stress-test scaling assumptions.
- Wave 2: London and Frankfurt. The European offices. Highest regulatory complexity. By this point, the team would have two waves of evidence about what works and what doesn’t.
- Wave 3: New York and Chicago. The US offices. Largest combined population. Last because they benefited from the most learning and the most refined support model.
- Wave 4: Dubai. Smallest office with unique regulatory requirements. Separated from the main waves because its requirements were different enough to warrant a tailored approach.
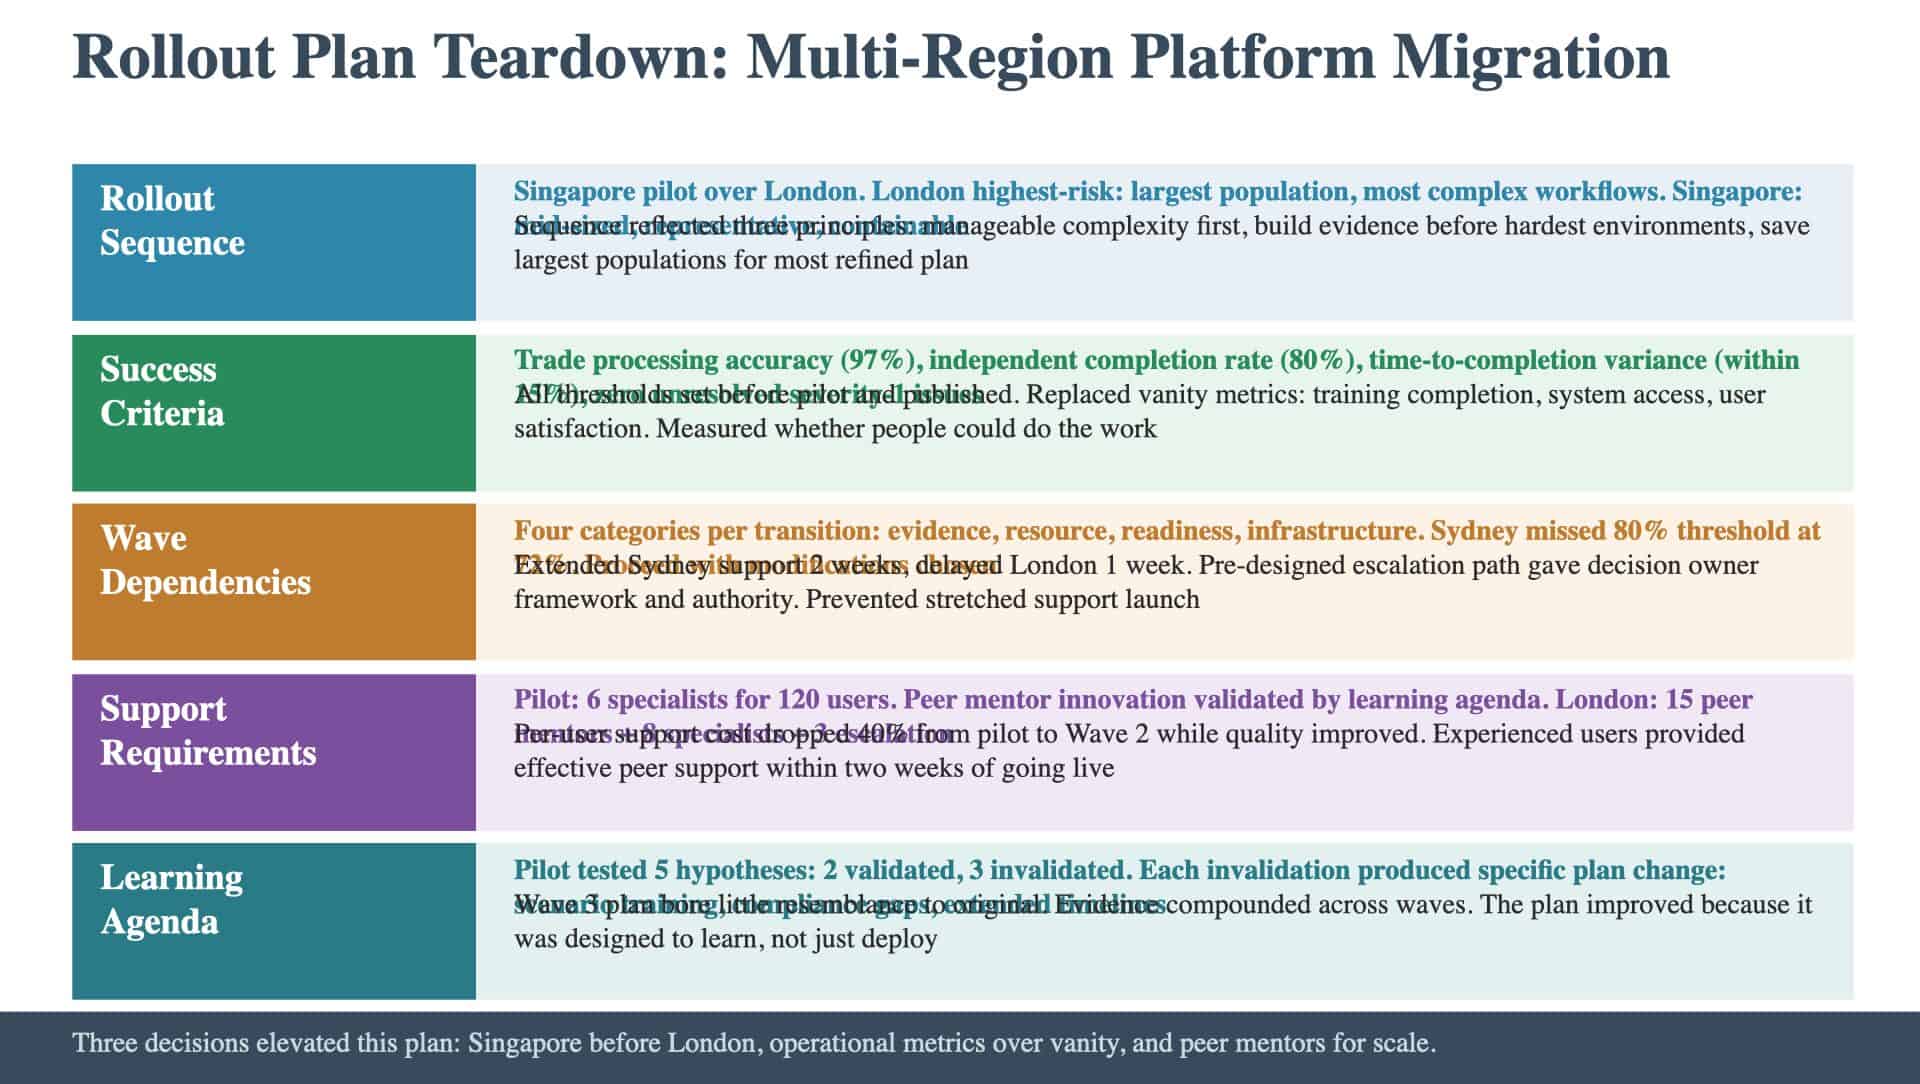
The sequence reflected three principles: start with manageable complexity, build evidence before tackling the hardest environments, and save the largest populations for when the plan is most refined.
The Success Criteria: Why Trade Completion Replaced Training Completion
The initial success criteria included training completion rates, system access provisioning, and user satisfaction scores. The consulting team flagged all three as vanity metrics. Training completion measured attendance. System access measured provisioning. User satisfaction measured opinion at a point in time. None measured whether people could actually do the work. The revised criteria for each wave:
- Trade processing accuracy: Percentage of trades processed without error in the new system during the first two weeks. Threshold: 97 percent (matching the legacy system baseline).
- Independent completion rate: Percentage of operations tasks completed without escalation to the support team. Threshold: 80 percent by end of week two.
- Time-to-completion variance: Average processing time in the new system compared to legacy. Threshold: within 15 percent of legacy system times by end of week three.
- Critical issue count: Number of severity-1 issues during the wave. Threshold: zero unresolved severity-1 issues before the next wave begins.
Thresholds were set before the pilot and published to all regional offices. This created two benefits: the pilot team knew exactly what they were being measured against, and later-wave teams could see the evidence from earlier waves.
The Wave Dependencies: Where the Plan Almost Broke
The dependency map included four categories for each transition: evidence (criteria met), resource (support available), readiness (audience prepared), and infrastructure (systems configured). The map almost broke between Wave 1 and Wave 2. Hong Kong met all success criteria. Sydney met three of four but missed the independent completion rate: 72 percent versus the 80 percent threshold. The escalation path had three options: proceed, proceed with modifications, or pause. The decision owner, the global program director (separate from the regional heads who had timeline accountability), chose to proceed with modifications. The modification: extend the support team presence in Sydney by two weeks and delay the London launch by one week to allow the support team to stabilize Sydney before redeploying to Europe. The one-week London delay was controversial. The London managing director had communicated the original date to staff. The program team had to communicate the change, explain the evidence basis, and manage the perception that a one-week delay signaled problems. In retrospect, the delay prevented what would have been a worse outcome: launching London with a support team that was still addressing Sydney issues. The escalation path, designed in advance, gave the decision owner the framework and authority to make the call quickly.
The Support Requirements: The Peer Mentor Innovation
The pilot support model was intensive: a dedicated team of 6 support specialists for Singapore’s 120 users. The team knew this ratio wouldn’t scale to London’s 800 users. The solution came from the learning agenda. One of the pilot hypotheses was: “Experienced users can provide effective first-level support to peers within two weeks of going live.” The pilot validated this. By week three, the most proficient Singapore users were resolving common questions for their colleagues faster than the formal support team. The team formalized this into a peer mentor program. After each wave, the top-performing users were identified, given a half-day orientation, and deployed as peer mentors for the next wave. By Wave 2, the support model was:
- Peer mentors from Wave 1 handling routine questions and workflow guidance
- Dedicated support specialists handling technical issues and complex process questions
- Escalation team handling severity-1 issues and cross-system problems
This model scaled. London launched with 15 peer mentors from Hong Kong and Sydney (deployed virtually, supported by video and messaging), 8 dedicated specialists, and a 3-person escalation team. The per-user support cost dropped by 40 percent from pilot to Wave 2 while support quality improved.
The Learning Agenda: What Each Wave Taught the Next
The pilot tested five hypotheses. Two were validated. Three were invalidated. Invalidated hypothesis 1: “The existing training materials are sufficient for the operations team.” Reality: operations specialists needed scenario-based training, not just system training. The team built 12 scenario exercises before Wave 1. Invalidated hypothesis 2: “The compliance workflow can migrate as designed.” Reality: the Singapore compliance team identified three regulatory reporting requirements that the new system didn’t accommodate. The team added a compliance gap remediation workstream before Wave 1. Invalidated hypothesis 3: “Two weeks is sufficient for users to reach independent proficiency.” Reality: traders reached proficiency in one week, but operations specialists needed three weeks. The support timeline was extended for operations audiences in subsequent waves. Each invalidated hypothesis produced a specific plan change. The Wave 1 plan was meaningfully different from the pilot plan because of what the pilot revealed. The Wave 2 plan incorporated Wave 1 lessons. By Wave 3, the team was executing a deployment plan refined by three prior waves of evidence.
What Made This Rollout Plan Work
Two decisions elevated this plan. Putting Singapore before London chose learning over visibility, and replacing vanity metrics with operational metrics created genuine evaluation points. The peer mentor model solved the scaling problem that would have made London support unsustainable. The Rollout Plan was revised after every wave. The Wave 3 plan bore little resemblance to the original. That’s not a sign of poor planning. The question is whether the team treats the Rollout Plan as a hypothesis that improves with evidence from every wave: or whether it defends the original plan and treats every adaptation as a failure.
Download the Rollout Plan template and a filled example to see what each section looks like in practice. Access the template library