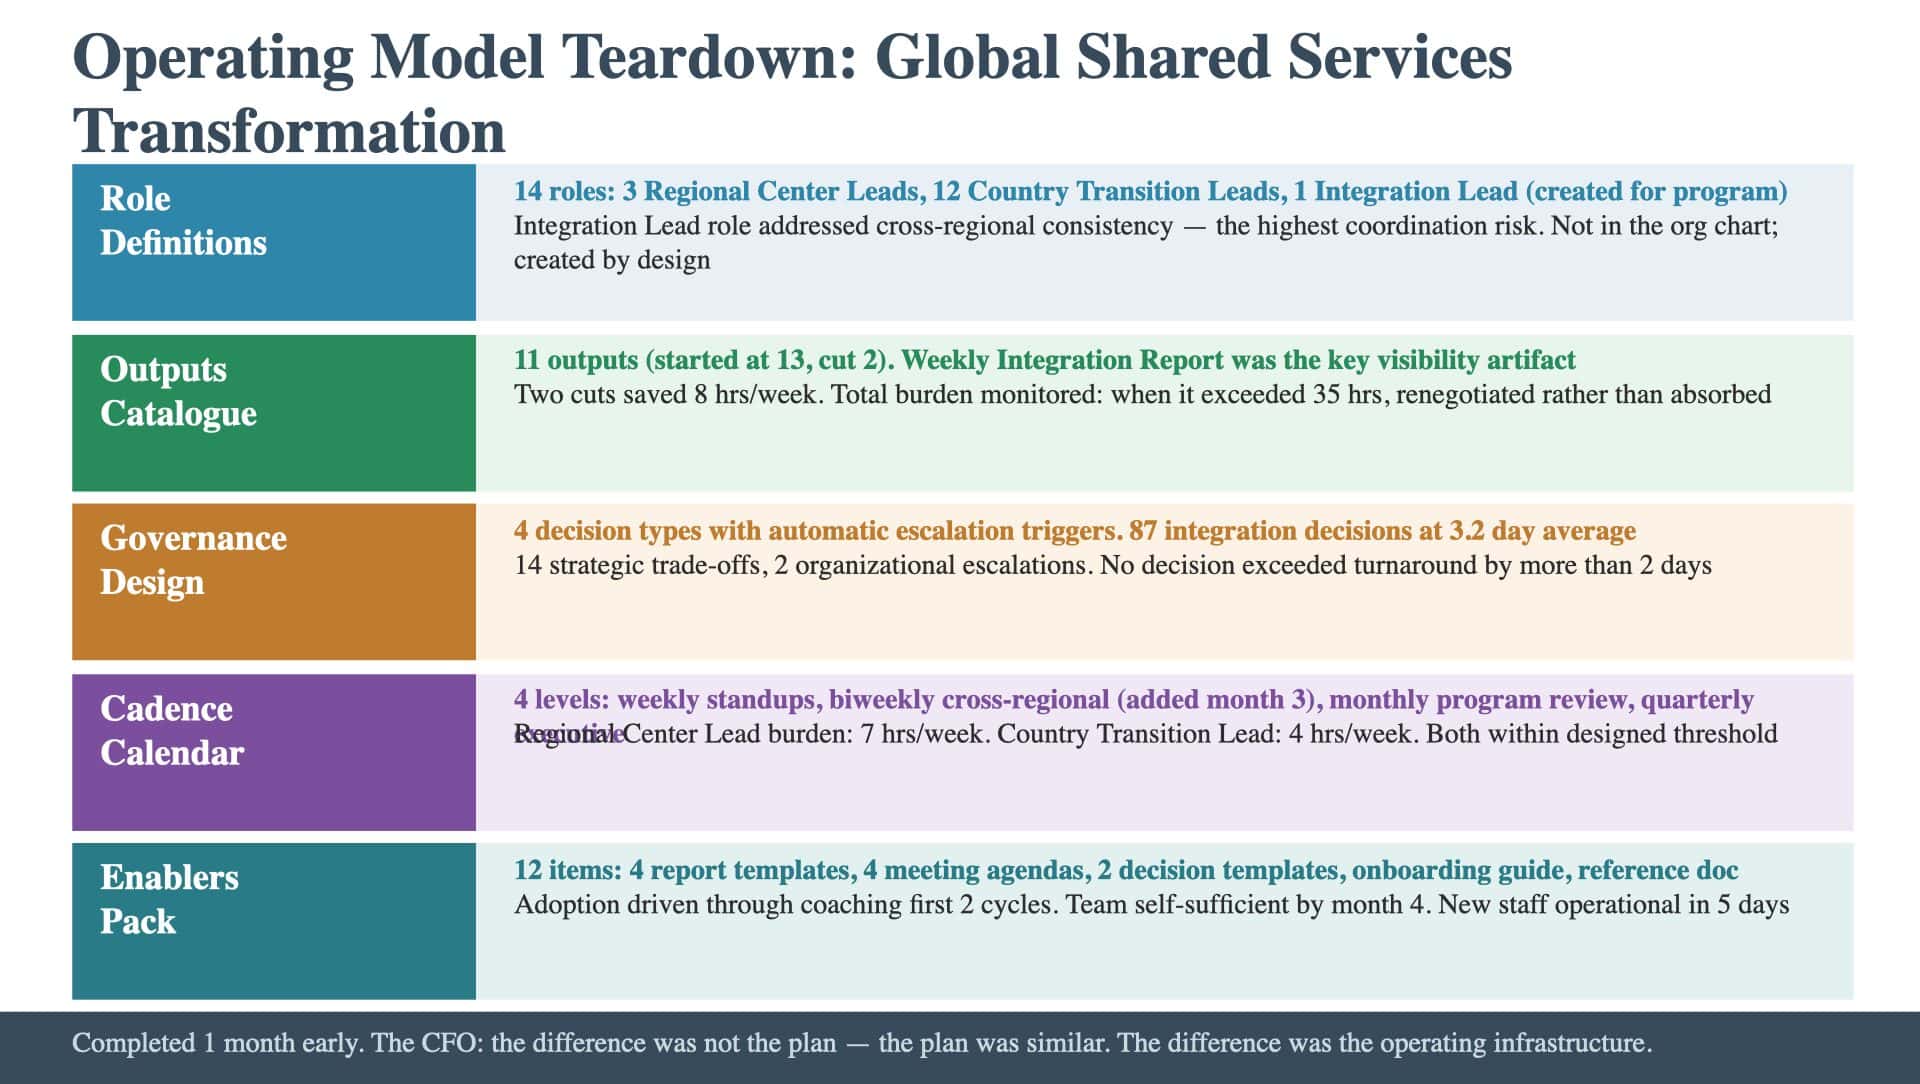
This article walks through a completed Operating Model from a global shared services transformation at a Fortune 500 industrial conglomerate. The initiative consolidated finance, procurement, and HR operations from twelve country offices into three regional shared services centers. The program spanned eighteen months with a team of approximately two hundred people across internal staff and two consulting firms.
The walkthrough follows the artifact component by component, showing what the consultants designed, how it operated during execution, and where specific coordination decisions directly sustained program alignment.
The Engagement Context
The organization had attempted a shared services consolidation four years earlier. That effort stalled after eight months when coordination between the country offices, the regional centers, and the corporate program team broke down. Each group operated on its own assumptions, reported in its own format, and made decisions without consulting the others. The program did not fail for lack of a plan. It failed for lack of operating infrastructure.
The second attempt began with an explicit requirement from the CFO: design the operating infrastructure before execution starts. The Operating Model was built during the final two weeks of the planning phase, after the Integrated Roadmap was complete.
Component 1: Role Definitions
The program defined fourteen key roles. The role definitions focused on outcomes, not activities.
The Regional Center Lead (three roles, one per region)
- Owned the outcome of regional readiness: the shared services center in their region is staffed, trained, and operational by the Go-Live date.
- Success indicators: staffing completion rate, training certification rate, and operational readiness assessment score.
The Country Transition Lead (twelve roles, one per country)
- Owned the outcome of clean transition: the country’s operations are migrated to the regional center with zero critical process disruptions.
- Success indicators: process migration completion rate, error rate during transition period, and employee satisfaction score.
The Integration Lead (one role)
- Owned the outcome of cross-regional consistency: processes delivered by the three regional centers are consistent with the global standard. This role did not appear in the organizational chart. It was created specifically for the program because the consultants identified cross-regional consistency as the highest coordination risk. Without a single person accountable for consistency, each regional center would optimize for its own context and the global standard would fragment. The Role Charters sub-artifact is where definitions like these are formalized.
- Success indicators: cross-regional process consistency score, number of variance exceptions requiring resolution, and global standard compliance rate.
The architecture nobody builds describes why role creation (not just role assignment) is sometimes necessary. The Integration Lead role addressed a coordination gap that the existing organizational structure could not cover.
Component 2: The Outputs Catalogue
The catalogue defined eleven outputs. The consultants started with thirteen and cut two during the design process because they failed the “what would break” test.
The Weekly Integration Report (the most critical output)
- Produced by the Integration Lead; consumed by the Program Director and the three Regional Center Leads.
- Tracked: process migration status by country and function, cross-regional consistency metrics, and integration issues requiring resolution.
- This single output provided the visibility that the first attempt lacked.
Two outputs were cut during design:
- A detailed risk log update: consolidated into the monthly program review instead of produced weekly.
- A stakeholder communication summary: determined to be informational, consumed by no decision-maker for any specific decision.
- Cutting these saved approximately eight hours per week of production time.
Output burden was measured and managed:
- Producing all eleven outputs required approximately thirty hours per week across the PMO team.
- Monitored monthly. When burden exceeded thirty-five hours in month four (due to additional steering committee data requests), the team renegotiated the committee’s information requirements rather than absorbing the additional workload.
The roadmap that tells you nothing describes the visibility failure when outputs are not connected to decisions. This catalogue’s strength was its discipline: every output had a named consumer and a named decision.
Component 3: Governance Design
The governance design classified decisions into four types with specific pathways.
Execution decisions (within a single country or single regional center)
- Decided by the Country Transition Lead or Regional Center Lead within two business days.
- Example: adjusting the training schedule for a specific country based on local staffing availability.
Integration decisions (cross-country or cross-regional)
- Decided by the Program Director with input from affected leads within five business days.
- Example: resolving a process design conflict between two country offices’ requirements.
Strategic trade-offs (scope, budget, or timeline changes)
- Decided by the steering committee with Program Director recommendation within two weeks.
- Example: deferring one country’s migration to the next wave due to regulatory requirements.
Organizational escalations (changes requiring executive committee approval)
- Decided by the executive committee within four weeks.
- Example: changing the regional center model from three centers to two based on cost analysis.
Escalation triggers were automatic. If an integration decision was not resolved within five business days, it escalated to the steering committee agenda without requiring anyone to initiate the escalation. The PMO tracked decision age and triggered escalations automatically.
Results over eighteen months of execution:
- Eighty-seven integration decisions processed (average resolution: 3.2 business days)
- Fourteen strategic trade-offs (average resolution: 8.5 business days)
- Two organizational escalations (resolved in twelve and nineteen business days)
- No decision exceeded its defined turnaround time by more than two business days.
Programs that failed with good plans documents the first attempt’s governance failure. The second attempt’s governance processed over one hundred decisions without a single stall that affected the program timeline.
Component 4: The Cadence Calendar
The cadence operated across four levels with explicit connections.
Weekly (Monday)
- Thirty-minute regional standups (three meetings, one per region) producing regional status inputs.
- Sixty-minute program-wide coordination meeting (Program Director, Regional Leads, Integration Lead, PMO) reviewing the Weekly Integration Report and resolving issues escalated from regional standups.
Biweekly (alternate Wednesdays)
- Ninety-minute cross-regional working session (all Country Transition Leads and Regional Center Leads) addressing process consistency issues and sharing lessons learned.
- This meeting did not exist in the original design. It was added in month three when the model review revealed that cross-country knowledge transfer was happening through ad hoc calls rather than through a structured mechanism.
Monthly (last Thursday)
- Two-hour program review (Steering Committee, Program Director, Regional Leads) assessing program health, reviewing risk status, and making strategic trade-off decisions.
Quarterly (scheduled around the executive committee calendar)
- Half-day executive assessment reviewing program progress against strategic objectives and addressing organizational-level constraints.
Meeting burden by role:
- Regional Center Lead: seven hours per week (within the designed threshold of eight to ten hours).
- Country Transition Lead: four hours per week.
Why programs fail identifies meeting proliferation as a coordination failure. This program’s cadence was designed for restraint: the minimum rhythm that kept a two-hundred-person, twelve-country program coordinated.
Component 5: The Enablers Pack
The enablers pack contained twelve items:
- Four report templates (matching the outputs catalogue)
- Four meeting agenda templates (matching the cadence calendar)
- Two decision request templates (matching the governance design)
- One onboarding guide
- One operating model reference document
Adoption was driven through three mechanisms:
- The consulting team ran the first two cycles of every meeting and every report using the templates, coaching the program team through the process.
- The Program Director referenced the operating model explicitly in every program-wide communication during the first quarter.
- The model review in month three assessed adoption and identified two templates that needed simplification (the country-level status template was streamlined from fifteen fields to eight).
Results: By month four, the program team was operating the model without consulting team support. New team members (thirty-two additional staff onboarded during execution) were operational within five business days using the onboarding guide and templates.
What Happened During Execution
The program completed in seventeen months, one month ahead of the eighteen-month timeline. The Operating Model sustained coordination across twelve country transitions, three regional center launches, and two significant scope changes (one country deferred and one country accelerated).
The model evolved during execution:
- Month three: the biweekly cross-regional working session was added.
- Month six: two outputs were consolidated.
- Month nine: the escalation trigger for integration decisions was shortened from five business days to three, based on decision velocity data showing faster resolution was possible and beneficial.
The CFO’s assessment at program completion: “The difference between this attempt and the last one was not the plan. The plan was similar. The difference was the operating infrastructure. This time, we knew how to run.”
The question is whether the team invests in the operating infrastructure before execution starts, or discovers the cost of that investment only after coordination has broken down.