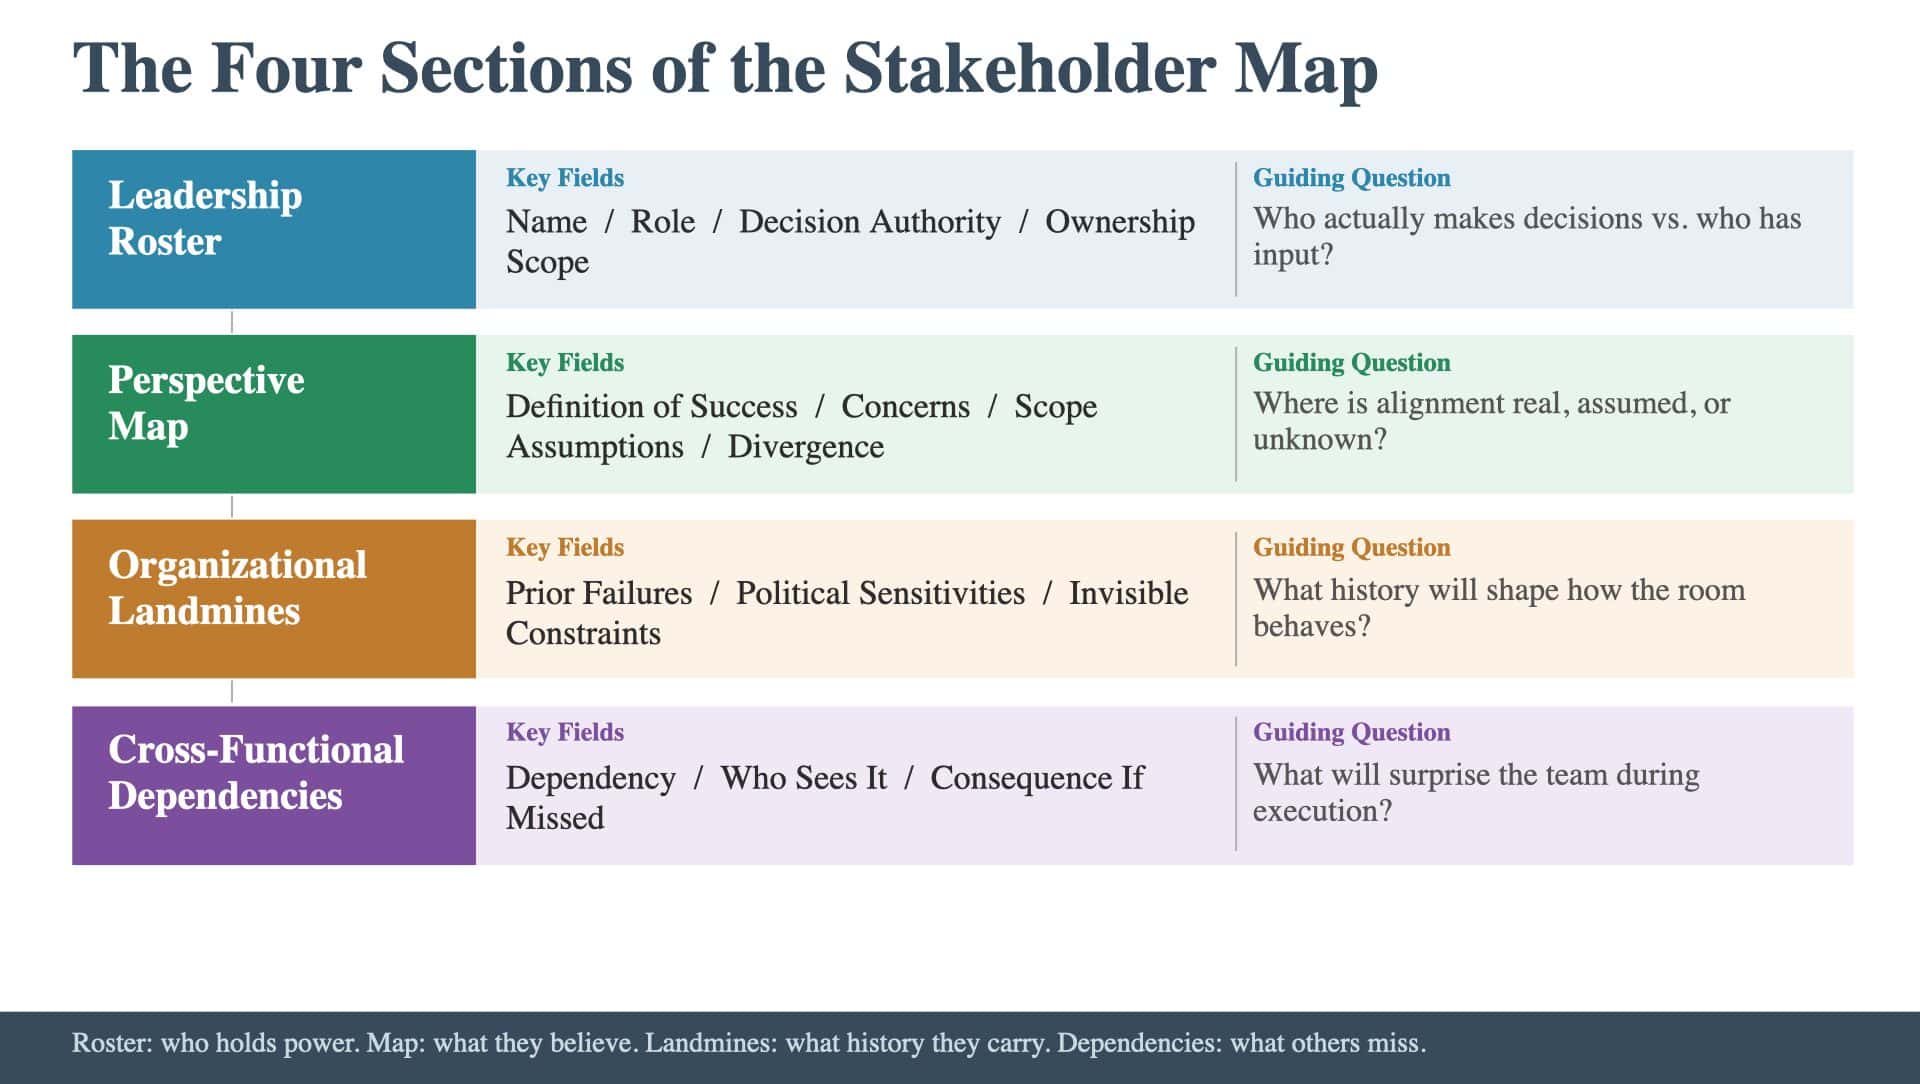
The Stakeholder Map is built from one-on-one conversations. We sit with each leader individually, before the group convenes, and reveal what documents cannot capture: beliefs, concerns, interpretation gaps, and the organizational history that will shape how the room behaves. The raw material is conversational. The output is architectural. Four sections turn those conversations into a structured artifact the planning team can build on.
Section 1: Leadership Roster
The Leadership Roster answers the question: Who is the core leadership team, and what authority do they hold? The roster goes beyond an org chart excerpt. For each stakeholder, it captures:
- Name and title. The structural position.
- Role in the initiative. What they are accountable for within the program, which may differ from their organizational title.
- Decision authority. Whether they own decisions, provide input, or hold veto power over specific domains.
- Ownership scope. The specific deliverables, workstreams, or functions they control.
The quality bar: the roster captures who actually makes decisions versus who has input rights, and where authority is ambiguous or contested. Titles do not tell the team who makes decisions. Sometimes the most senior person defers to someone else. Sometimes two people both believe they own the same decision. The roster makes those dynamics visible. A useful roster also identifies where authority gaps exist: decisions that no one owns, or decisions where the ownership is assumed but untested. These gaps become inputs to the governance model designed in Step 3. If the Architecture Blueprint assigns decision authority without knowing where authority is already contested, the governance model will be theoretical rather than operative. Stakeholder mapping beyond the org chart starts here: with a roster that tells the truth about how power works.
Section 2: Perspective Map
The Perspective Map answers the question: What does each stakeholder believe about the initiative, and where do beliefs diverge? For each stakeholder, the map captures:
- Their definition of success. What outcome they are personally measuring the initiative against.
- Their primary concerns. What they believe is most likely to go wrong.
- Their assumptions about scope and timeline. What they believe is included and what they believe is achievable.
- Divergence from other stakeholders. Where their view differs from peers, whether they know it or not.
The synthesis question: Where are people aligned, where are they misaligned, and where do they not realize they are misaligned? The third category is the most dangerous. Two VPs who both say “we’re aligned on the timeline” but hold different assumptions about what the timeline contains, i.e., one expects a phased rollout and the other expects a full deployment, will not discover the gap until the roadmap session forces a choice. The Perspective Map surfaces that gap in advance so the consultants can design the session to address it. The narrative takeaway from this section tells the board where real alignment exists and where alignment is assumed. The moment a VP realizes that their peers hold a different definition of success is the moment the planning engagement produces its first real value. The Perspective Map ensures that moment happens during pre-work, not during a session that was designed to produce a roadmap.
Section 3: Organizational Landmines
The Organizational Landmines section answers the question: Where are the political sensitivities, historical friction, and invisible constraints? This section captures what will never appear in a document: the organizational history that shapes behavior. For each landmine, the map records:
- The specific event or dynamic. Not “tension between teams” but the specific prior failure, the specific grievance, the specific pattern that will influence how people engage.
- Who is affected. Which stakeholders carry the history and how it shapes their stance.
- The behavioral implication. What we should expect in collaborative settings: defensiveness, avoidance, active opposition, or over-caution.
The quality bar: a useful landmine list is specific enough to be actionable. “There’s a trust issue” is not actionable. “The last cross-functional initiative was canceled after six months, and the VP of Operations publicly attributed the failure to Engineering’s inability to deliver on time; Engineering believes the scope was changed three times without their input” gives the consultants enough specificity to navigate the dynamic. We use this section to design collaborative sessions that account for the room’s history. If two leaders have unresolved friction, the session design avoids putting them in direct conflict on Day 1. If a function feels historically marginalized, the session design gives them a visible role early. The landmine list does not resolve organizational history. It ensures the consultants are not surprised by it. Making the invisible visible starts with acknowledging what the organization carries into the room.
Section 4: Cross-Functional Dependencies
The Cross-Functional Dependencies section answers the question: What dependencies does each stakeholder see that others may not? Every function has visibility into constraints and handoffs that are invisible to other functions. Engineering knows about technical debt that will slow delivery. Operations knows about calendar conflicts that will create deployment collisions. Finance knows about budget constraints that have not been communicated to the program team. One-on-ones pull these into the open. For each dependency, the map captures:
- The dependency itself. What one function needs from another.
- Who sees it. Which stakeholder surfaced it, and whether other stakeholders are aware.
- The consequence of missing it. What happens during execution if this dependency is not managed.
The quality bar: if the dependency list only contains what everyone already knows, the one-on-ones have not done their job. The value of this section is in the dependencies that are invisible to everyone except the person who holds them. These are the dependencies that will cause collisions during execution if they are not identified during planning. The synthesis question: What is going to surprise the team during execution if it is not surfaced now? The narrative takeaway names the dependencies that carry the most risk: the ones where one function holds a constraint that another function’s plan depends on, and neither knows about the other’s position. This section feeds directly into the Architecture Blueprint (Beat 3), where dependencies become structural inputs to workstream boundaries, handoff contracts, and the dependency diagram. Without the dependency list from the one-on-ones, the architecture is built on assumptions about how functions interact rather than evidence. Stopping alignment and starting mapping means building the architecture on what the one-on-ones revealed, not on what the org chart suggests.
How the Four Sections Work Together
The Leadership Roster tells us who holds power. The Perspective Map tells us what those people believe. The Organizational Landmines tell us what history they carry. The Cross-Functional Dependencies tell us what they see that others do not. The question is whether you know what the room thinks before the room convenes: or whether you discover the answer live, when the cost of surprise is measured in collaborative hours the team cannot get back.
Go Deeper: The Stakeholder Map
This article covers one dimension of the Stakeholder Map, the second of nine artifacts in the Planning & Roadmapping method. The Stakeholder Map answers the board question: “Who sees what?” Explore the full Stakeholder Map →
Keep Reading
Ready to close specific gaps in your Stakeholder Map? These articles show you how: