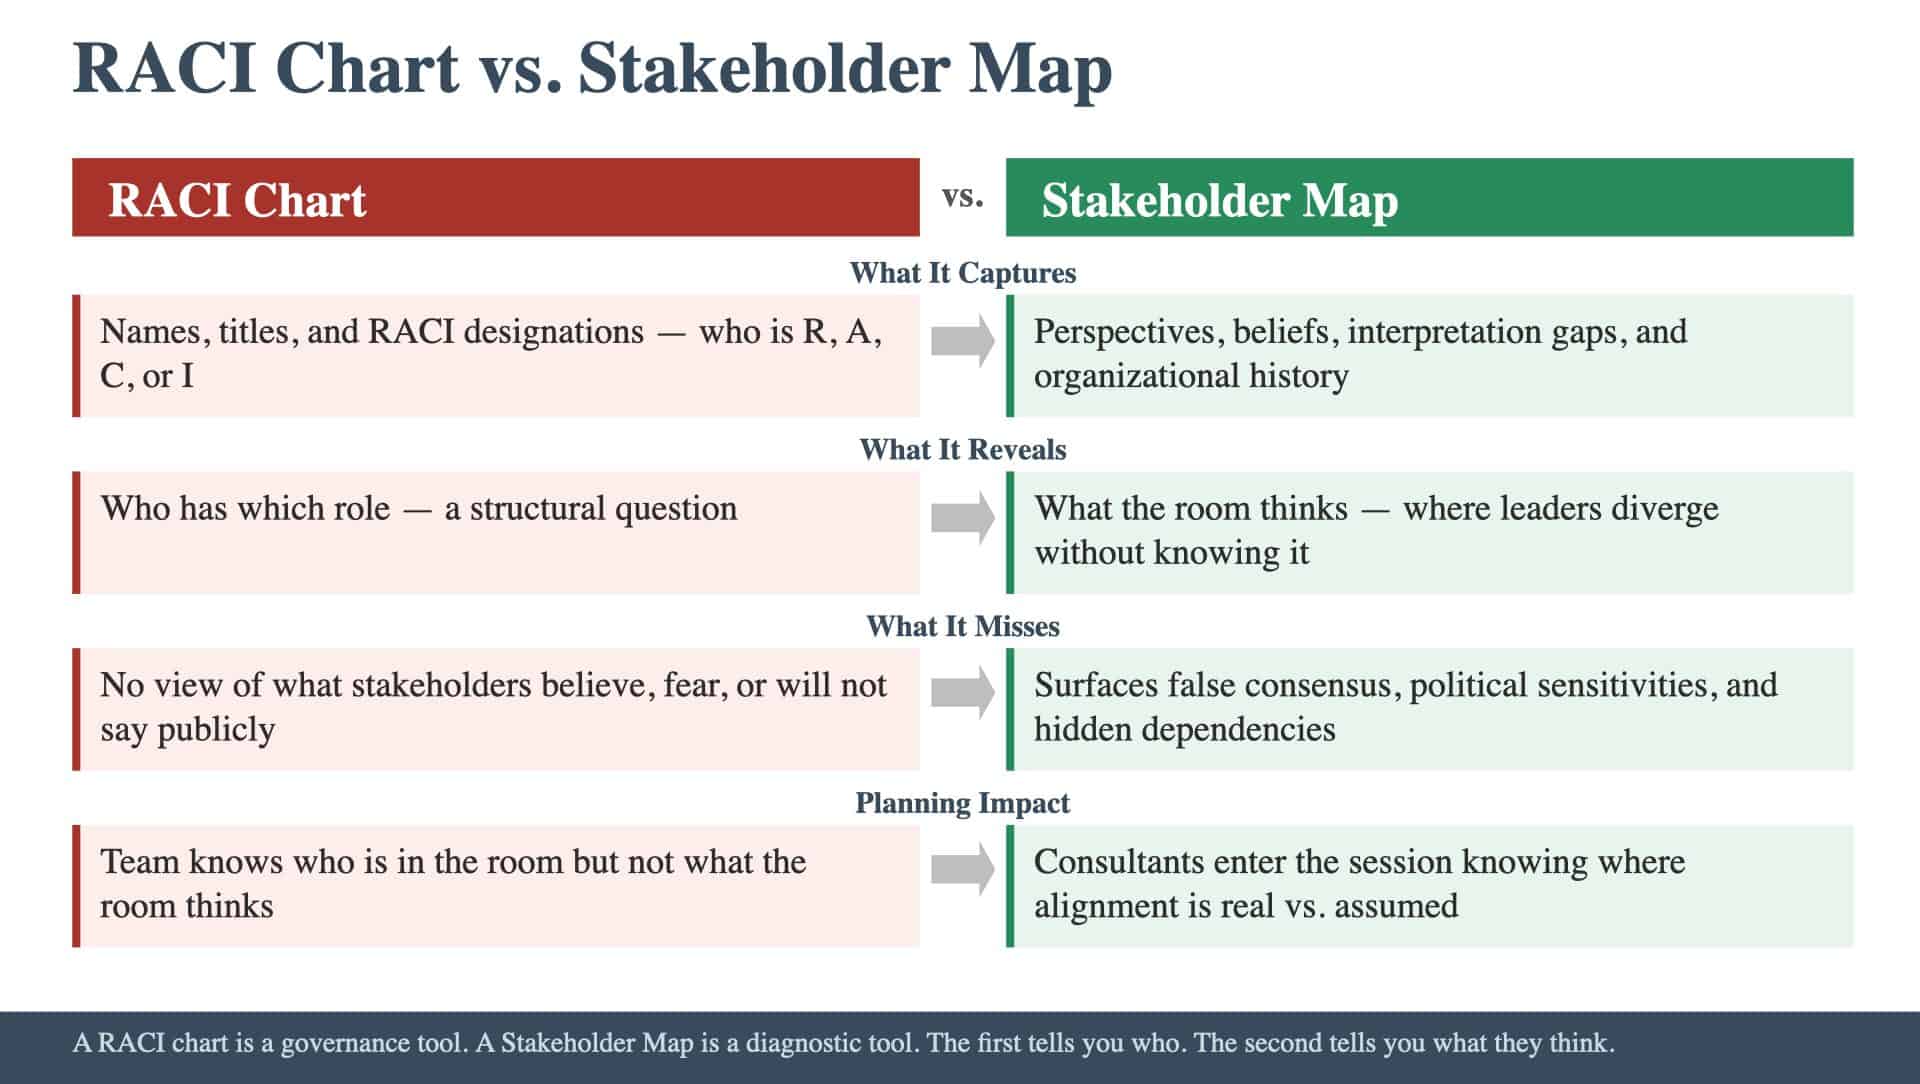
Every cross-functional program has a stakeholder list. It lives in the charter or the project management tool: names, titles, roles, and a RACI designation. Responsible, Accountable, Consulted, Informed. The list tells the team who is involved. It does not tell the team what those people believe, where they disagree, or what they will not say in a group setting. A Stakeholder Map is a different instrument. It captures perspectives, not positions. It documents what each leader thinks about the initiative, where interpretation gaps exist between leaders who believe they are aligned, and where the organizational history will shape how people behave when collaborative sessions begin. The difference between a RACI chart and a Stakeholder Map is the difference between knowing who is in the room and knowing what the room thinks.
What a RACI Chart Captures (and What It Cannot)
A RACI chart organizes people into four categories relative to a decision or deliverable. It answers a structural question: who has which role? That question matters for governance. It does not answer the questions that determine whether the first cross-functional session will produce alignment or expose fault lines the team did not anticipate. Four questions remain unanswered:
- What does each stakeholder believe about the initiative’s primary objective? Two leaders can both be “Accountable” for a workstream and hold fundamentally different views of what the program is trying to achieve. The RACI chart treats them as interchangeable. The Stakeholder Map reveals the gap.
- Where do stakeholders assume alignment that does not exist? The most dangerous misalignments are the ones where people use the same language to describe different things. “We’re aligned on the timeline” might mean one VP expects a phased rollout over six months while another expects a full deployment in Q3. The RACI chart does not surface this.
- What will people not say in a group setting? A leader who privately believes the initiative is under-resourced may not raise that concern in front of the sponsor. A function head who thinks another team’s plan is unrealistic may stay quiet to avoid conflict. These perspectives shape behavior during collaborative sessions whether they are voiced or not.
- What organizational history will influence how people behave? Prior failures, broken trust between teams, turf disputes that never fully resolved. These do not appear in any governance document, but they determine whether the room will engage openly or defensively.
A RACI chart is a governance tool. A Stakeholder Map is a diagnostic tool. The first tells the team how decisions should flow. The second tells the team what the room actually thinks before the room convenes.
What the Stakeholder Map Contains
The Stakeholder Map is the second output artifact in a nine-step planning methodology. It answers the board question: “Who matters and what do they see?” It is structured around four sections, each designed to capture a different dimension of the human landscape the planning team will navigate. Leadership Roster. A table of every key stakeholder with their role, decision authority, and ownership scope. The quality bar goes beyond titles: the roster captures who actually makes decisions versus who has input rights, and where authority is ambiguous or contested. If two people both believe they own the same decision, the roster makes that visible. Perspective Map. A structured view of what each stakeholder believes about the initiative: their definition of success, their primary concerns, their assumptions about scope and timeline, and where their view diverges from other stakeholders. The synthesis question: where are people aligned, where are they misaligned, and where do they not realize they are misaligned? That last category is the most dangerous because it produces false consensus that collapses during execution. Organizational Landmines. A list of political sensitivities, historical friction, and invisible constraints identified through one-on-one conversations. A useful landmine list is specific: not “tension between Product and Engineering” but the specific prior event, the specific grievance, and the specific behavior it will produce in collaborative settings. We need enough detail to navigate the dynamic or address it directly. Cross-Functional Dependencies. A list of dependencies that surfaced only through individual conversations, i.e., constraints and handoffs that one function sees but others do not. The quality bar: if the dependency list only contains what everyone already knows, the one-on-ones have not done their job. The value is in the dependencies that are invisible to everyone except the person who holds them. Each section produces a narrative takeaway for the board. Stacked together, the four takeaways compose the second beat of a board-ready narrative that tells leadership who is involved and what the human landscape looks like.
Why the First Session Depends on It
The first cross-functional session is where initiatives either gain momentum or lose it. Walk in without understanding the stakeholder landscape, and three things happen. Collaborative time gets consumed by discovery. The team spends the session identifying misalignments that could have been anticipated. A VP raises a constraint that contradicts the working assumption. A function head challenges the scope definition. These are legitimate concerns, but they belong in the pre-work, not in the room. When they surface live, the session becomes a discovery exercise instead of a planning exercise. Conflicts trigger without warning. Organizational history shapes how people behave. A leader who was burned by a prior initiative will be cautious. A team that felt blamed for a past failure will be defensive. Without knowing where the landmines are, we can’t design the session to navigate around them. The result is a room that shuts down or escalates instead of engaging productively. Hidden dependencies surface during execution. Dependencies that only one function sees get missed in planning because that function was never asked. The dependency identifies during execution when it causes a collision: a workstream discovers that its deliverable requires an input from another team that was never scheduled. Programs where fourteen stakeholders had zero visibility into each other’s constraints trace the failure back to this gap: the dependencies were known to someone, but never compiled into shared visibility.
How the Stakeholder Map Connects to the Rest of the Program Plan
The Stakeholder Map is Beat 2 of a nine-beat board narrative. Beat 1, the Landscape Brief, establishes the factual foundation: what documents exist, where they conflict, and where the gaps are. Beat 2 adds the human dimension: who sees what, and where do their perspectives diverge from what the documents say. The two artifacts are designed to work together. The Landscape Brief reveals what the organization has written down. The Stakeholder Map reveals what the organization believes. The gap between the two is where the real alignment work lives. Alignment nobody actually agreed to is the most common finding: documents that suggest consensus, and one-on-ones that reveal divergence. The question is whether your planning process tests stakeholder alignment before the room convenes: or whether you discover the divergence during a session that was designed to produce a roadmap.
Go Deeper: The Stakeholder Map
This article covers one dimension of the Stakeholder Map, the second of nine artifacts in the Planning & Roadmapping method. The Stakeholder Map answers the board question: “Who sees what?” Explore the full Stakeholder Map →
Keep Reading
Ready to close specific gaps in your Stakeholder Map? These articles show you how: