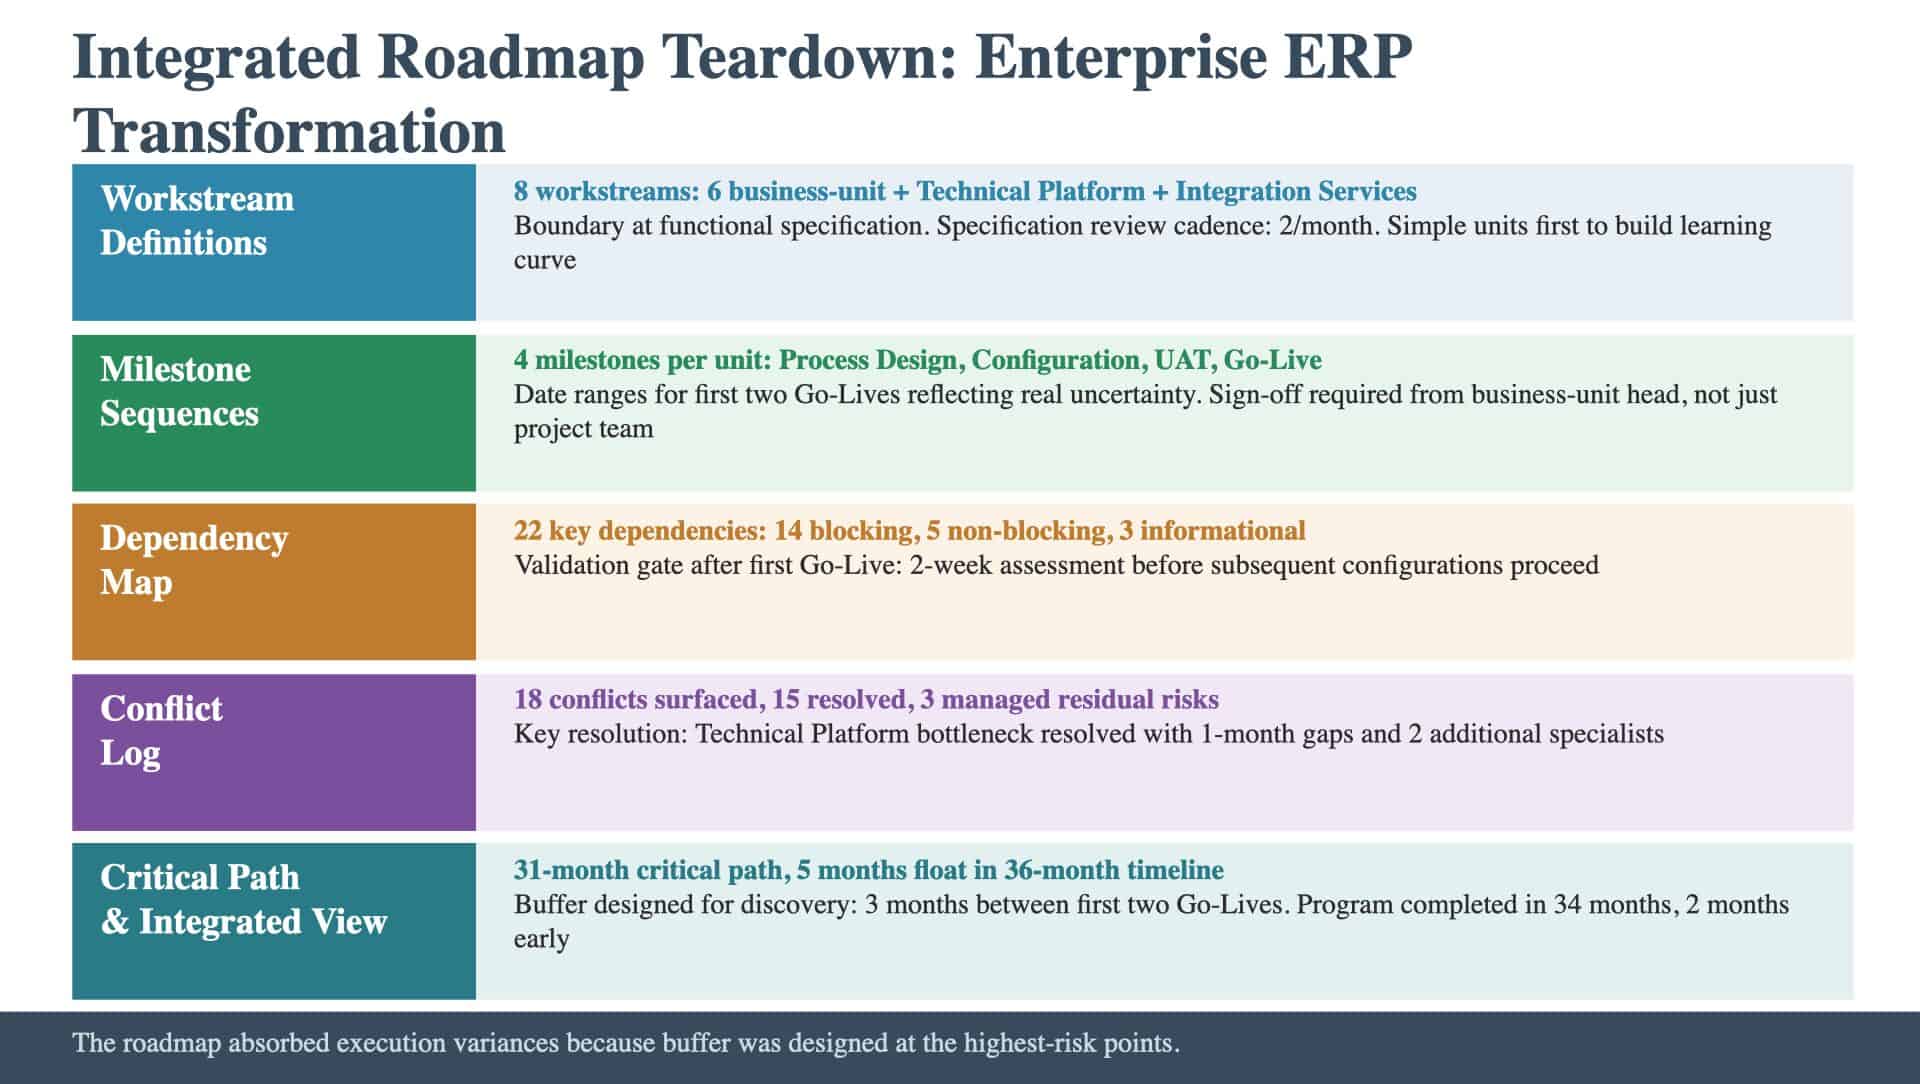
This article walks through a completed Integrated Roadmap from an enterprise-wide ERP transformation at a Fortune 500 manufacturing company. The initiative involved replacing legacy ERP systems across six business units, consolidating onto a single platform, and redesigning business processes to take advantage of the new system’s capabilities. The program spanned thirty-six months with a budget of approximately ninety million dollars. The walkthrough follows the artifact component by component, showing what the planning team built, what the integration exercise revealed, and where specific roadmap decisions directly shaped execution outcomes.
The Engagement Context
The organization had operated six independent ERP instances, one per business unit, for over fifteen years. Each instance had been customized to the point where no two business units ran the same processes on the same system. The consolidation required a technology migration and a process harmonization effort that touched every function in the company. The complexity was not primarily technical. It was organizational. Six business units, each with its own processes, its own data models, and its own definition of how core business functions should work. The Integrated Roadmap needed to sequence the work across all six business units while managing dependencies between the technical migration and the process harmonization.
Component 1: Workstream Definitions
The program defined eight workstreams: six business-unit workstreams (one per unit, responsible for process harmonization and user adoption within that unit) and two cross-cutting workstreams (Technical Platform, responsible for the core system configuration and data migration, and Integration Services, responsible for interfaces between the new system and retained legacy systems). The critical boundary decision was between the business-unit workstreams and the Technical Platform workstream. This is the kind of decision that Workstream Scoping is designed to resolve. Business-unit workstreams owned process design and user acceptance. The Technical Platform workstream owned system configuration. The handoff point was the functional specification: each business unit produced a specification, and the Technical Platform workstream configured the system to match it. This boundary created a clear dependency chain but also a potential bottleneck: the Technical Platform workstream received specifications from six business units and had to configure all of them. The workstream definition anticipated this by establishing a specification review cadence (two specifications per month) and a priority sequence (business units with the simplest process changes first, creating a learning curve before the complex units). The architecture nobody builds describes why the boundary between business-unit and technical workstreams is an architectural decision. The boundary determines where coordination risk concentrates.
Component 2: Milestone Sequences
Each business-unit workstream had four major milestones: Process Design Complete (functional specification signed off by both the business unit and the Technical Platform workstream), Configuration Complete (system configured and unit-tested against the specification), User Acceptance Testing Complete (business users verified the system meets their requirements), and Go-Live (the business unit transitions to the new system). The milestone definitions were specific. Process Design Complete required sign-off from the business-unit process owner, the Technical Platform lead, and the Integration Services lead (because process changes often affected integration requirements). Configuration Complete required the system to pass a defined set of automated regression tests covering the specification. User Acceptance Testing Complete required sign-off from the business-unit head, not just the project team. Two milestones used date ranges rather than specific dates. The first business unit’s Go-Live was set at months twelve to fourteen, with the range reflecting uncertainty about the data migration timeline (which depended on data quality assessment results not yet available). The second business unit’s Go-Live was set at months sixteen to eighteen, with the range reflecting dependency on the first unit’s lessons learned. The roadmap that tells you nothing contrasts this approach with the common alternative: thirty-six months of specific dates that assume perfect execution. The date ranges signaled where the team was honest about uncertainty.
Component 3: The Dependency Map
The Dependency Map contained twenty-two key dependencies. Fourteen were blocking (primarily the specification-to-configuration chain between business units and the Technical Platform), five were non-blocking (primarily data quality assessments that informed but did not gate subsequent work), and three were informational (primarily lessons-learned transfers between business units). The most consequential dependency was between the first business unit’s Go-Live and all subsequent business units’ Configuration Complete milestones. The first Go-Live would validate the overall approach. If it succeeded, subsequent configurations could proceed with confidence. If it revealed systemic issues, all subsequent configurations would need to be reassessed. The dependency map classified this as a “validation gate”: a blocking dependency that was also a decision point. The roadmap included a two-week assessment period after the first Go-Live, during which the program leadership would evaluate the results and confirm or adjust the approach for subsequent units. The complete deliverable map describes the deliverable inventory that fed this dependency mapping. Each of the twenty-two dependencies referenced a specific deliverable with format and acceptance criteria.
Component 4: The Conflict Log
The initial roadmap sessions identified eighteen conflicts. By the end of the planning phase, fifteen were resolved and three were documented as managed residual risks. The most significant resolved conflict was a resource collision: the Technical Platform workstream could not configure two business units simultaneously given its staffing level. The resolution involved sequencing configurations with a one-month gap between them and hiring two additional configuration specialists for the peak-demand period (months eight through twenty-four). The three residual risks were: the vendor’s commitment to a specific product patch (needed for one business unit’s process design) had not been contractually confirmed, the data migration tool’s performance at the volume required for the largest business unit was untested, and the Integration Services workstream’s dependency on a legacy system API that was scheduled for deprecation during the program timeline. Each had a named owner, a management plan, and trigger conditions for escalation. Programs that failed with good plans documents what happens when conflicts enter execution unresolved. This program’s discipline in resolving fifteen of eighteen conflicts before execution was a direct investment in execution stability.
Component 5: The Critical Path and Integrated View
The critical path ran through the first business unit: Process Design, Configuration, User Acceptance Testing, Go-Live, and the two-week assessment. From there, it ran through the largest business unit (which had the most complex process changes and the longest Configuration period) and ended with that unit’s Go-Live. The total critical-path duration was thirty-one months, leaving five months of total float in the thirty-six-month timeline. The float was not evenly distributed: three months sat between the first and second Go-Lives (intentionally, to accommodate the validation gate and potential rework), and two months sat at the end of the program. The integrated view was a single-page visualization showing all eight workstreams, their milestone sequences, the twenty-two key dependencies, and the critical path highlighted in a distinct color. A senior leader could trace the critical path in under two minutes. The near-critical path (through the third business unit, which had the second-most-complex process changes) was identified and monitored separately. The visualization also showed the three residual risks as annotated callouts on the milestones they affected. This made the risks visible to anyone reviewing the roadmap, not just the team that tracked the risk register.
What Happened During Execution
The first business unit’s Go-Live occurred at month thirteen (within the twelve-to-fourteen-month range). The two-week assessment identified one systemic issue: the data migration tool’s reconciliation process was slower than projected, adding approximately one week to each subsequent unit’s migration timeline. Because the roadmap had built a three-month gap between the first and second Go-Lives, the one-week-per-unit delay was absorbed without adjusting the overall timeline. The buffer was designed for exactly this type of discovery. The vendor patch residual risk materialized: the patch was delayed by two months. Because the risk had a management plan, the affected business unit rephased its process design to accommodate the delay, and the rephasing was contained within that unit’s existing float. The program completed in thirty-four months, two months ahead of the thirty-six-month timeline. The critical-path analysis was validated: the actual critical path matched the planned critical path, and the buffer built at the highest-risk points absorbed the variances that occurred. The question is whether your Integrated Roadmap builds in validation gates, managed buffers, and contingency plans that absorb the variances execution will inevitably produce: or whether those variances add months to your timeline because the roadmap assumed perfect execution.
Keep Reading
Explore the foundations and common gaps: