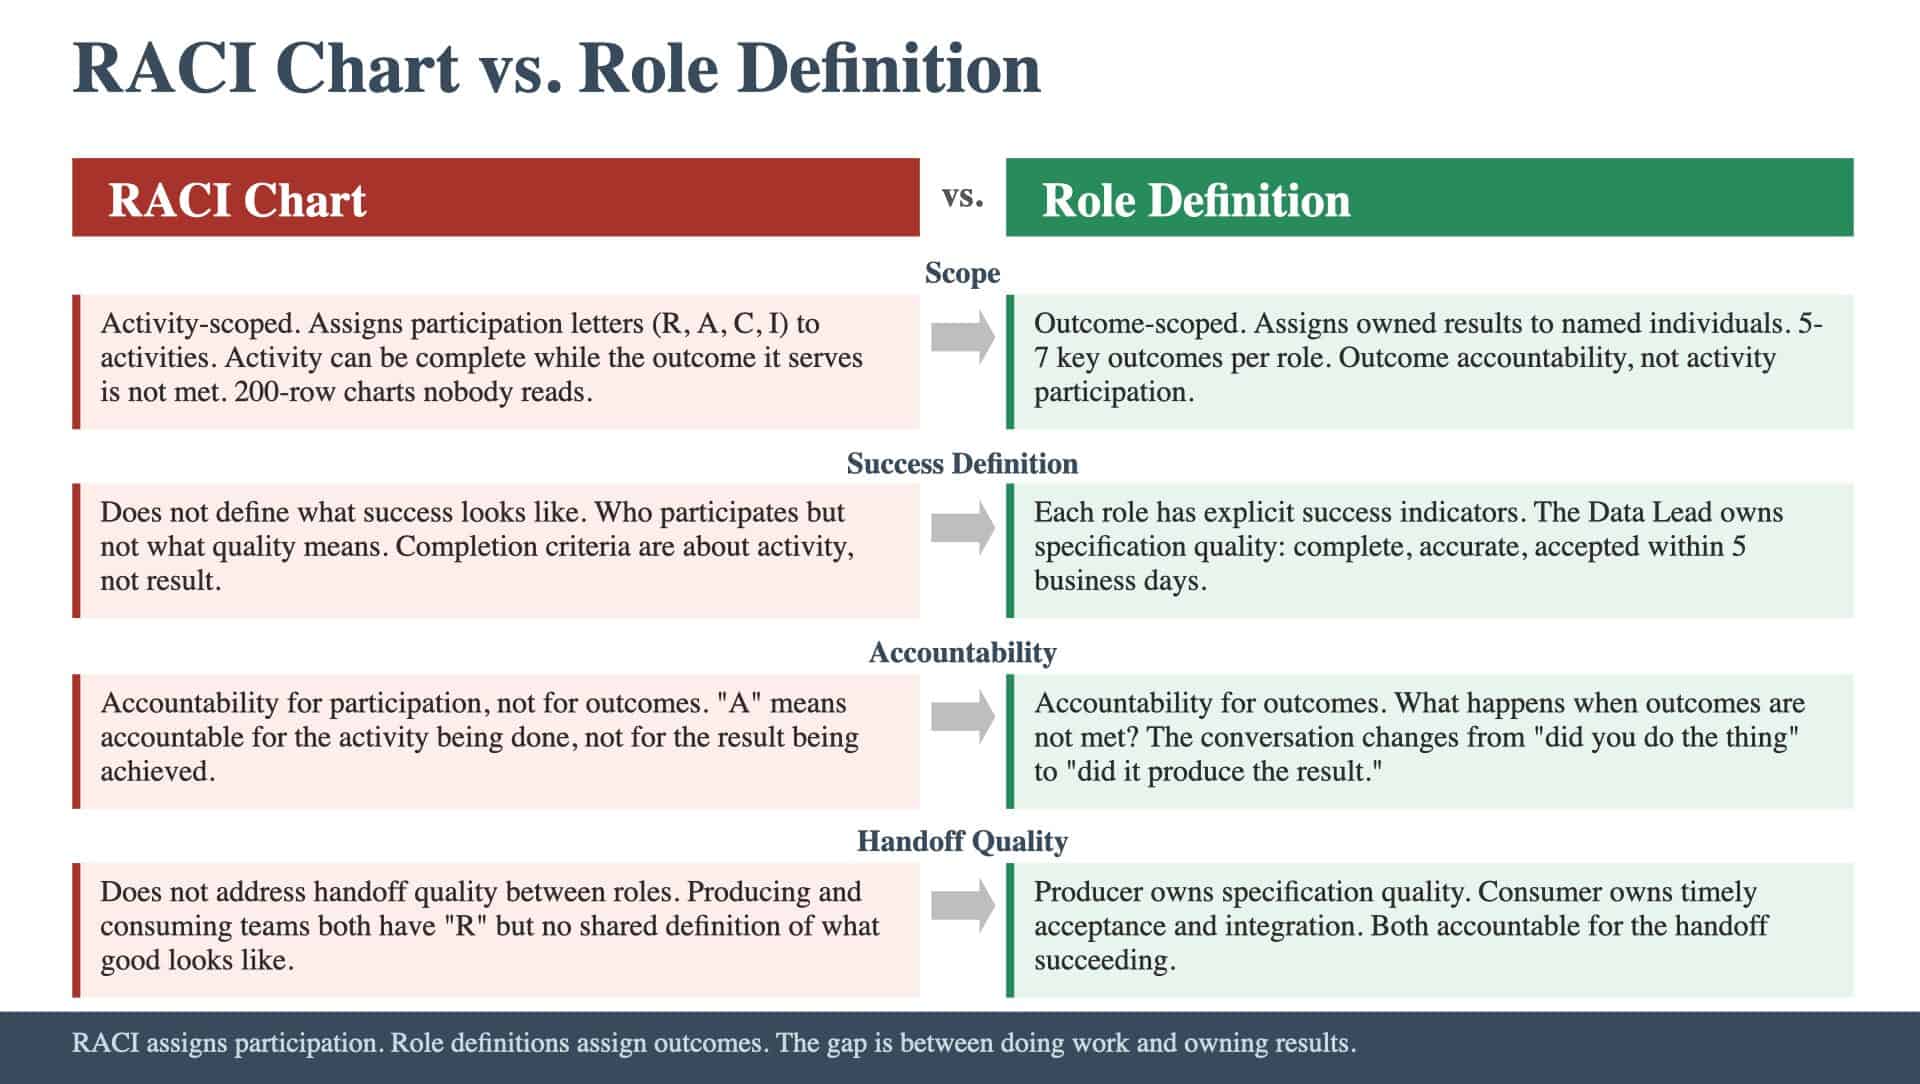
The program has a RACI chart. Every major activity has letters assigned: R for Responsible, A for Accountable, C for Consulted, I for Informed. The chart was built during planning, reviewed by the program leadership, and shared with the team. It looks like role clarity. It is not. A RACI chart assigns letters to activities. Role definitions assign outcomes to people. The gap between the two is the gap between knowing who does the work and knowing who owns the result.
What RACI Charts Actually Do
RACI charts map activities to participation types. For “integration testing,” the chart might show: Technology Lead is Responsible, Program Director is Accountable, Business Analysts are Consulted, and the Steering Committee is Informed. The chart answers the question: for this specific activity, who is involved and how? This is useful for activity coordination. It prevents the common failure where three people assume someone else is handling a task and the task falls through the cracks. When the chart is well-maintained and covers the key activities, teams know who to go to for each piece of work. But RACI charts have structural limitations that role definitions address. RACI is activity-scoped, not outcome-scoped. The chart says the Technology Lead is responsible for integration testing. It does not say the Technology Lead is accountable for the outcome of integration testing: zero critical defects at go-live. The activity can be complete (all test cases executed) while the outcome is not met (critical defects remain). The RACI chart treats the activity as done. The program needs the outcome. RACI is granular, not strategic. A comprehensive RACI chart might have two hundred rows. No one reads a two-hundred-row chart. The chart is too detailed to serve as a role clarity tool and too static to serve as a coordination tool. Role definitions are concise: five to seven key outcomes per role, each with measurable success criteria. RACI does not define success. The chart says who participates. It does not say what success looks like. The Technology Lead is responsible for integration testing, but what does a successful integration testing outcome look like? How many test cycles? What defect threshold? What sign-off requirements? Without success criteria, accountability is theoretical. The architecture nobody builds describes the upstream input: architecture defines who owns which workstreams and how governance works. Role definitions translate that ownership into measurable accountability.
What Role Definitions Actually Do
Role definitions answer core questions for each key role on the program. What outcomes do you own? Not activities, not deliverables: outcomes. The program director owns program health: the initiative is on track, risks are managed, decisions are made within defined timelines, and stakeholders are confident in the program’s trajectory. The workstream lead owns workstream delivery: milestones are met, dependencies are delivered on time, and quality meets the specification. The Role Charters sub-artifact is where these outcome definitions are documented for every key seat. How will you know if you are succeeding? Each outcome has observable indicators. Program health is measured by milestone achievement rate, risk register accuracy (risks identified before they materialize), and decision cycle time (average time from issue identification to decision). Workstream delivery is measured by milestone completion against plan, dependency delivery timeliness, and defect rates. What happens when outcomes are not met? The accountability expectation specifies the response. If milestone achievement drops below threshold, the workstream lead initiates a recovery plan within one week and presents it at the next program review. If decision cycle time exceeds the defined limit, the governance model’s escalation pathway is triggered. The Decision Escalation Framework codifies these escalation pathways. The consequences are structural, not punitive: they define the system’s response, not the individual’s punishment. Programs that failed with good plans documents the accountability gap: programs where RACI charts existed but no one was clearly accountable for outcomes. Integration testing was completed (the activity was done) but the outcome (zero critical defects) was not met, and no one owned the gap.
The Gap in Practice
Consider a cross-functional dependency: the Data team produces a migration specification that the Application team consumes for system configuration. The RACI chart says: Data Lead is Responsible for producing the specification. Application Lead is Consulted during development. Program Director is Accountable. The chart correctly identifies who is involved. The role definition says: the Data Lead owns the outcome of specification quality. Success means the specification is complete (covers all data domains), accurate (validated against source systems), and accepted (signed off by the Application Lead within five business days of delivery). The Application Lead owns the outcome of timely acceptance: reviewing the specification and providing acceptance or documented rejection within the five-day window. The difference becomes visible when the specification arrives and the Application team discovers gaps. Under RACI: the Application team was Consulted, so they raise the gaps. The Data team is Responsible, so they address the gaps. But who owns the timeline impact? The RACI chart has no mechanism for this. Under role definitions: the Data Lead owns specification quality, so the gaps are the Data Lead’s accountability. The recovery plan is the Data Lead’s responsibility to initiate. The timeline impact is reported against the Data Lead’s outcome metrics. Making the invisible visible describes why making accountability explicit matters: when accountability is implicit, it becomes negotiable under pressure.
From RACI to Role Definitions: What Changes
Accountability conversations change. Instead of “whose task is this?” the question becomes “whose outcome is this?” The conversation shifts from activity allocation to outcome ownership. The shift is uncomfortable because outcome ownership is harder to share and harder to avoid. Performance visibility changes. Role definitions with observable indicators create a measurement system. The program director can assess whether each role is meeting its outcomes without micromanaging activities. The assessment is based on results, not effort. Handoff quality changes. When both sides of a handoff own outcomes (the producer owns delivery quality; the consumer owns timely acceptance), the handoff has accountability on both ends. Neither side can blame the other without also examining their own outcome. Recovery speed changes. When outcomes are not met, the role definition specifies the response. The recovery process is designed in advance, not improvised under pressure. The workstream lead does not need to wait for someone to tell them what to do; the role definition already specifies the expected response.
The Transition Challenge
The most common resistance to role definitions is that they create uncomfortable clarity. RACI charts are comfortable because they distribute participation. Role definitions are uncomfortable because they concentrate accountability. One person owns each outcome. That person’s success or failure is measurable. This discomfort is the point. Programs fail at coordination because accountability is diffuse. RACI charts contribute to diffusion by listing four types of participation for each activity. Role definitions counter diffusion by naming one person accountable for each outcome. The transition from RACI to role definitions does not eliminate the RACI chart. The chart remains useful for activity-level coordination. The role definitions sit above the RACI chart, providing the outcome-level accountability that the chart cannot deliver. The question is whether the program defines outcome ownership before execution pressure makes accountability negotiations impossible: or whether it discovers the gap when an outcome fails and no one owns the recovery.
Keep Reading
New to the Operating Model? Start with the foundations:
Ready to benchmark your work against best-in-class? See what excellence looks like: